|
MRAS
Multi Rocket Avionics System
|
|
MRAS
Multi Rocket Avionics System
|
Documentation for this project is located in the docs folder and in the source code. The documentation is generated using Doxygen and Graphviz. The documentation is generated using the Doxyfile in the project root. The Doxyfile is configured to generate documentation for the lib folder for markdown files located in the docs folder.
bin folder of Graphviz to your PATH environment variablebin folder of Doxygen to your PATH environment variabledoxygenOpen docs\html\index.html in a browser
Documentation is hosted online at the URL mras.sunride.space
When the documentation is updated, the hosted documentation is updated automatically.
Commits to the main branch trigger a GitHub Actions workflow. The workflow generates the documentation and pushes it to the gh-pages branch. GitHub charges organizations for hosting Pages sites from private repositories. To get around this, Vercel is used to deploy the files committed to the gh-pages branch.
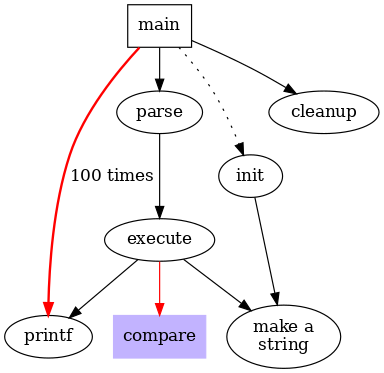
Graphs and diagrams can be created using the dot tool.
Example:
Output:
See the doxygen documentation: https://www.doxygen.nl/manual/formulas.html
We are using MathJax. From the docs:
For the HTML output there is also an alternative solution using MathJax which does not require the above tools. If you enable USE_MATHJAX in the configuration then the latex formulas will be copied to the HTML "as is" and a client side javascript will parse them and turn them into (interactive) images.
The distance between \((x_1,y_1)\) and \((x_2,y_2)\) is \(\sqrt{(x_2-x_1)^2+(y_2-y_1)^2}\).
\[ |I_2|=\left| \int_{0}^T \psi(t) \left\{ u(a,t)- \int_{\gamma(t)}^a \frac{d\theta}{k(\theta,t)} \int_{a}^\theta c(\xi)u_t(\xi,t)\,d\xi \right\} dt \right| \]